
City of Darwin is advancing its commitment to creating cool, green and liveable city with the installation of the Environmental Sensor Network.
This network consists of 8 strategically placed sensor poles across Darwin, designed to gather essential micro-climate data that informs our urban planning and decision-making processes.
Evolution of our environmental sensor network
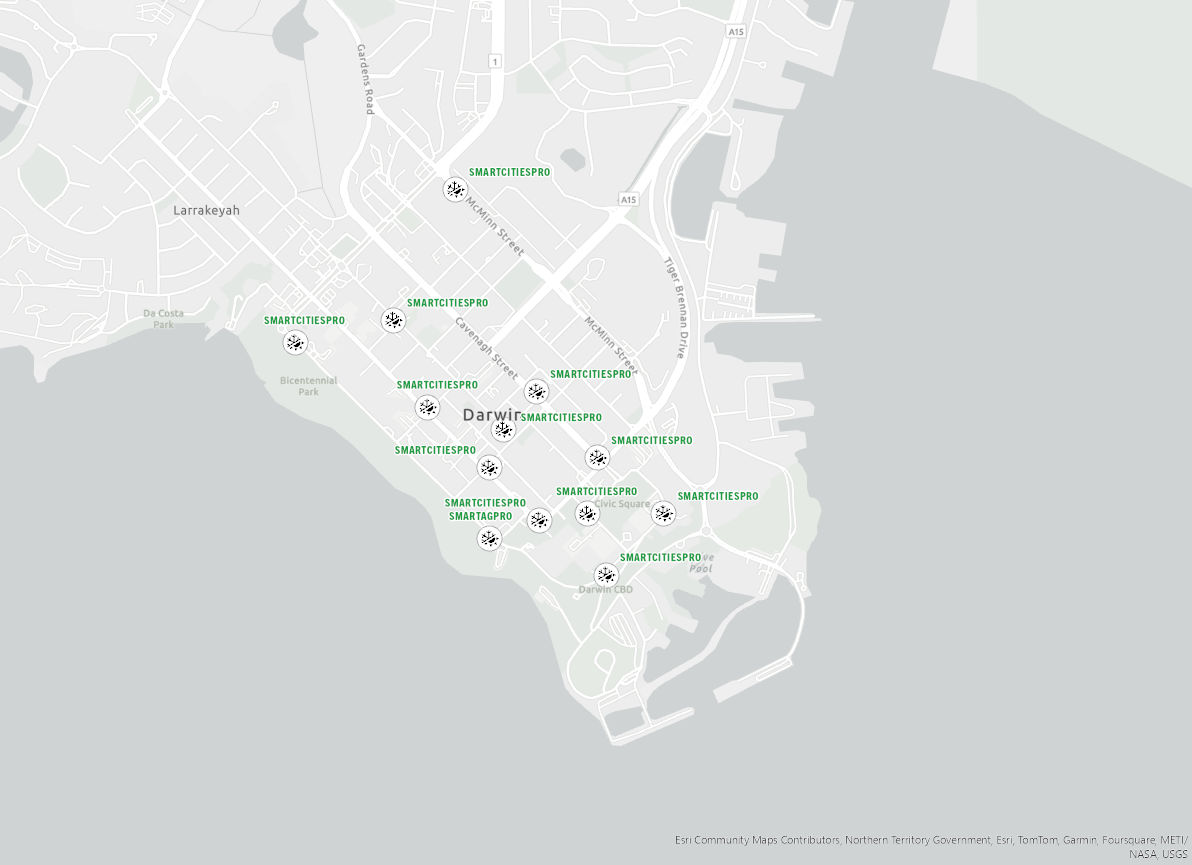
As part of our Switching on Darwin Smart City initiative back in 2019, our original environmental sensor network consisted of 24 small micro-climate and environmental sensors installed at various strategic locations throughout the CBD and broader municipality. These sensors collected valuable data on a range of environmental factors, including rainfall, wind speed and direction, temperature, dust levels, humidity, air pressure, and key air quality indicators such as nitrogen dioxide (NO₂), ozone (O₃), and carbon dioxide (CO₂) levels.
Supporting City of Darwin strategies
The Environmental Sensor Network plays a critical role in collecting data that helps us understand how outdoor conditions affect comfort and well-being in Darwin’s unique climate.
By monitoring key environmental factors such as temperature, wind speed, rainfall, and humidity, the network supports the below City of Darwin strategies:
- City of Darwin 2030 Movement Strategy
- City of Darwin Climate Emergency Strategy
- City of Darwin Greening Darwin Strategy
This data-driven approach allows us to implement effective solutions to maintain the city's liveability in a warming climate.
Please visit the Environmental Sensor Network portal at https://cityofdarwin.network
Attentis Intelligent Sensors
A sophisticated range of intelligent sensors that deliver 24-hour environmental intelligence, streamed through high-speed networks.
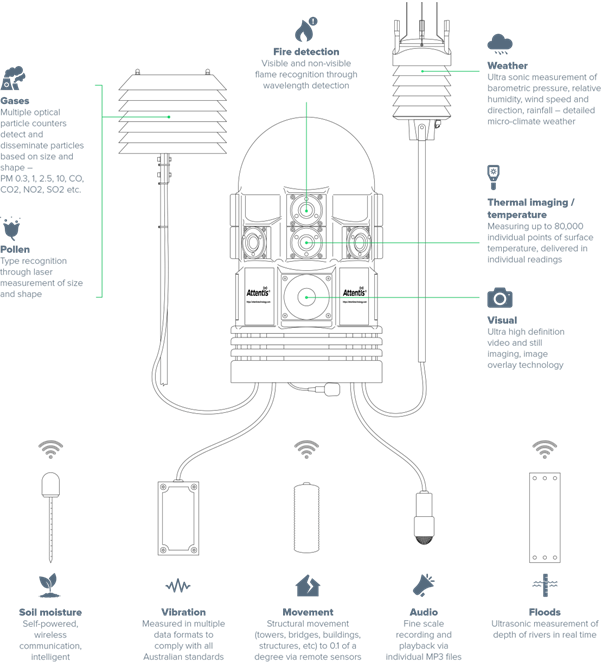
Image courtesy of Attentis Technology
Locations, Parameters and Purpose
| Unit | Location | Parameters | Purpose |
|---|---|---|---|
| 1 | Shoal Bay Waste Management Facility |
|
|
| 2 | Collins St Park (Muirhead) |
|
|
| 3 | Peace Park (Leanyer) |
|
|
| 4 | Yanyula Park (Anula) |
|
|
| 5 | Nightcliff Foreshore |
|
|
| 6 | Rapid Creek (Darwin Airport) |
|
|
| 7 | Dickward Drv (Coconut Grove) |
|
|
| 8 | Cavenagh St (Darwin City) |
|
|
Privacy and data collection
The Environmental Sensor Network is solely for environmental monitoring and does not capture any personal or identifying information. Our focus is on gathering valuable environmental data to enhance our city's liveability and mitigate the impacts of climate change.
Collaborative effort and future access to data
The placement of these sensor poles was determined through collaboration with key government and research organisations, ensuring that the data collected benefits a wide range of stakeholders.
We are also working towards developing a public platform where residents can easily access the environmental data gathered by the sensor network.
Explore the map below to see the locations of the sensor poles.
- Why do we need an Environmental Sensor Network?
-
The Environmental Sensor Network aims to understand and monitor micro-climate indicators by delivering 24-hour real-time information that offers early detection of critical events, such as fires and warnings on air quality, which is critical in supporting our Climate Emergency and Greening Strategies.
The multi-sensors provide vital information that can assist with:
- Early fire detection and notification;
- Improve public safety and awareness;
- Micro-climate weather information;
- Remove access to high risk locations;
- Monitors environmental impacts and;
- Delivers community resilience.
- How does it work?
-
The Environmental Sensor Network collects and delivers vital micro-climate data through the multi-sensors:
- Air quality
- Temperature
- Humidity
- Rainfall
- Wind
- Fire ignitions
The multi-sensors can provide real-time thermal and visual imaging to detect hot spots and changes in temperature that can identify areas of high risk. Each multi-sensor includes 360° visual access with time lapse video and still image recording from all units.
Comprehensive sensor information is then seamlessly streamed through high-speed wireless networks maintaining a real-time status of locations and regions to improve safety, health, efficiency, productivity and awareness.
- Where will be sensors be installed?
-
The 8 sensors will be installed at the following locations:
- Shoal Bay Waste Management Facility
- Muirhead - Colins St Park
- Leayner - Peace Park
- Anula - Yanyula Park
- Nightcliff Foreshore
- Darwin Airport
- Coconut Grove - Dickward Drive
- Darwin City - Cavenagh Street
- How do I access the Environmental Sensor Network?
-
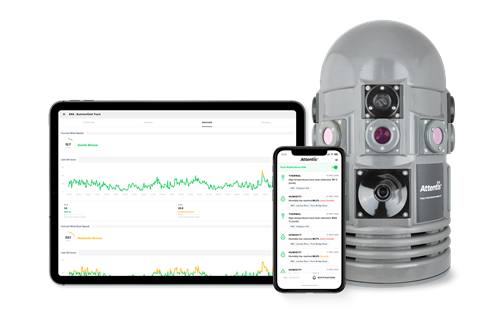
The Environmental Sensor Network features a designated user interface and mobile app that enables 24-hour access to live weather conditions and air quality information providing a new level of microclimate visibility.
Residents and visitors have the same 24-hour access to live weather conditions and air quality information.
Registered users can establish threshold alerts to receive instant notifications via email or SMS.
You can access the network by:
- Visiting cityofdarwin.network
- Downloading the Attentis App for iOS
- Downloading the Attentis App for Android
- Camera footage
-
This solution does include cameras for both visible and infra-red imaging, these sensors are covered by a Council Privacy Policy.
Key aspects include:
- Access to video (live, stills or time lapse) is restricted to approved City of Darwin officers only
- The primary use for the system is for climate emergency management and early detection of emergency events
- Cameras will not intentionally be used to look into adjacent or nearby private residential property